Catalog
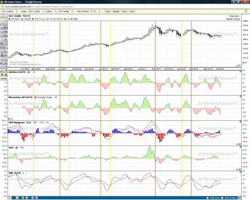 If a picture is worth a thousand words, a chart is worth 1,000 numbers. Designed for the experienced investor who wants to use charts to become more confident in investment decision making, the course will help investors to understand moving averages, trend-line analysis, relative strength analysis, ulcer indexes, price momentum oscillators, breadth and volume indicators and more. There will be time to explore several web-based charting services available to the public.
 Division of Lifelong Learning